Student Data
Student Achievement
Sanford Burnham Prebys Graduate School of Biomedical Sciences’ processes and outcomes are aimed at learning that supports students’ development as innovative scientists.
The information in this website is intended to help prospective students and others evaluate the Program’s educational goals and the student outcomes of the education we provide. We encourage prospective students to use this information to seek the right environment to pursue their educational and scientific goals.
Course Learning Outcomes
Retention and Graduation Data
Retention rates measure the percentage of first time entering students who are seeking a graduate degree who return to the institution to continue their studies the following fall. Graduation rate tracks the progress of students who began their studies as full-time, first-time PhD seeking students to see if they complete a degree within 150% of ‘normal time’ for completing the program.
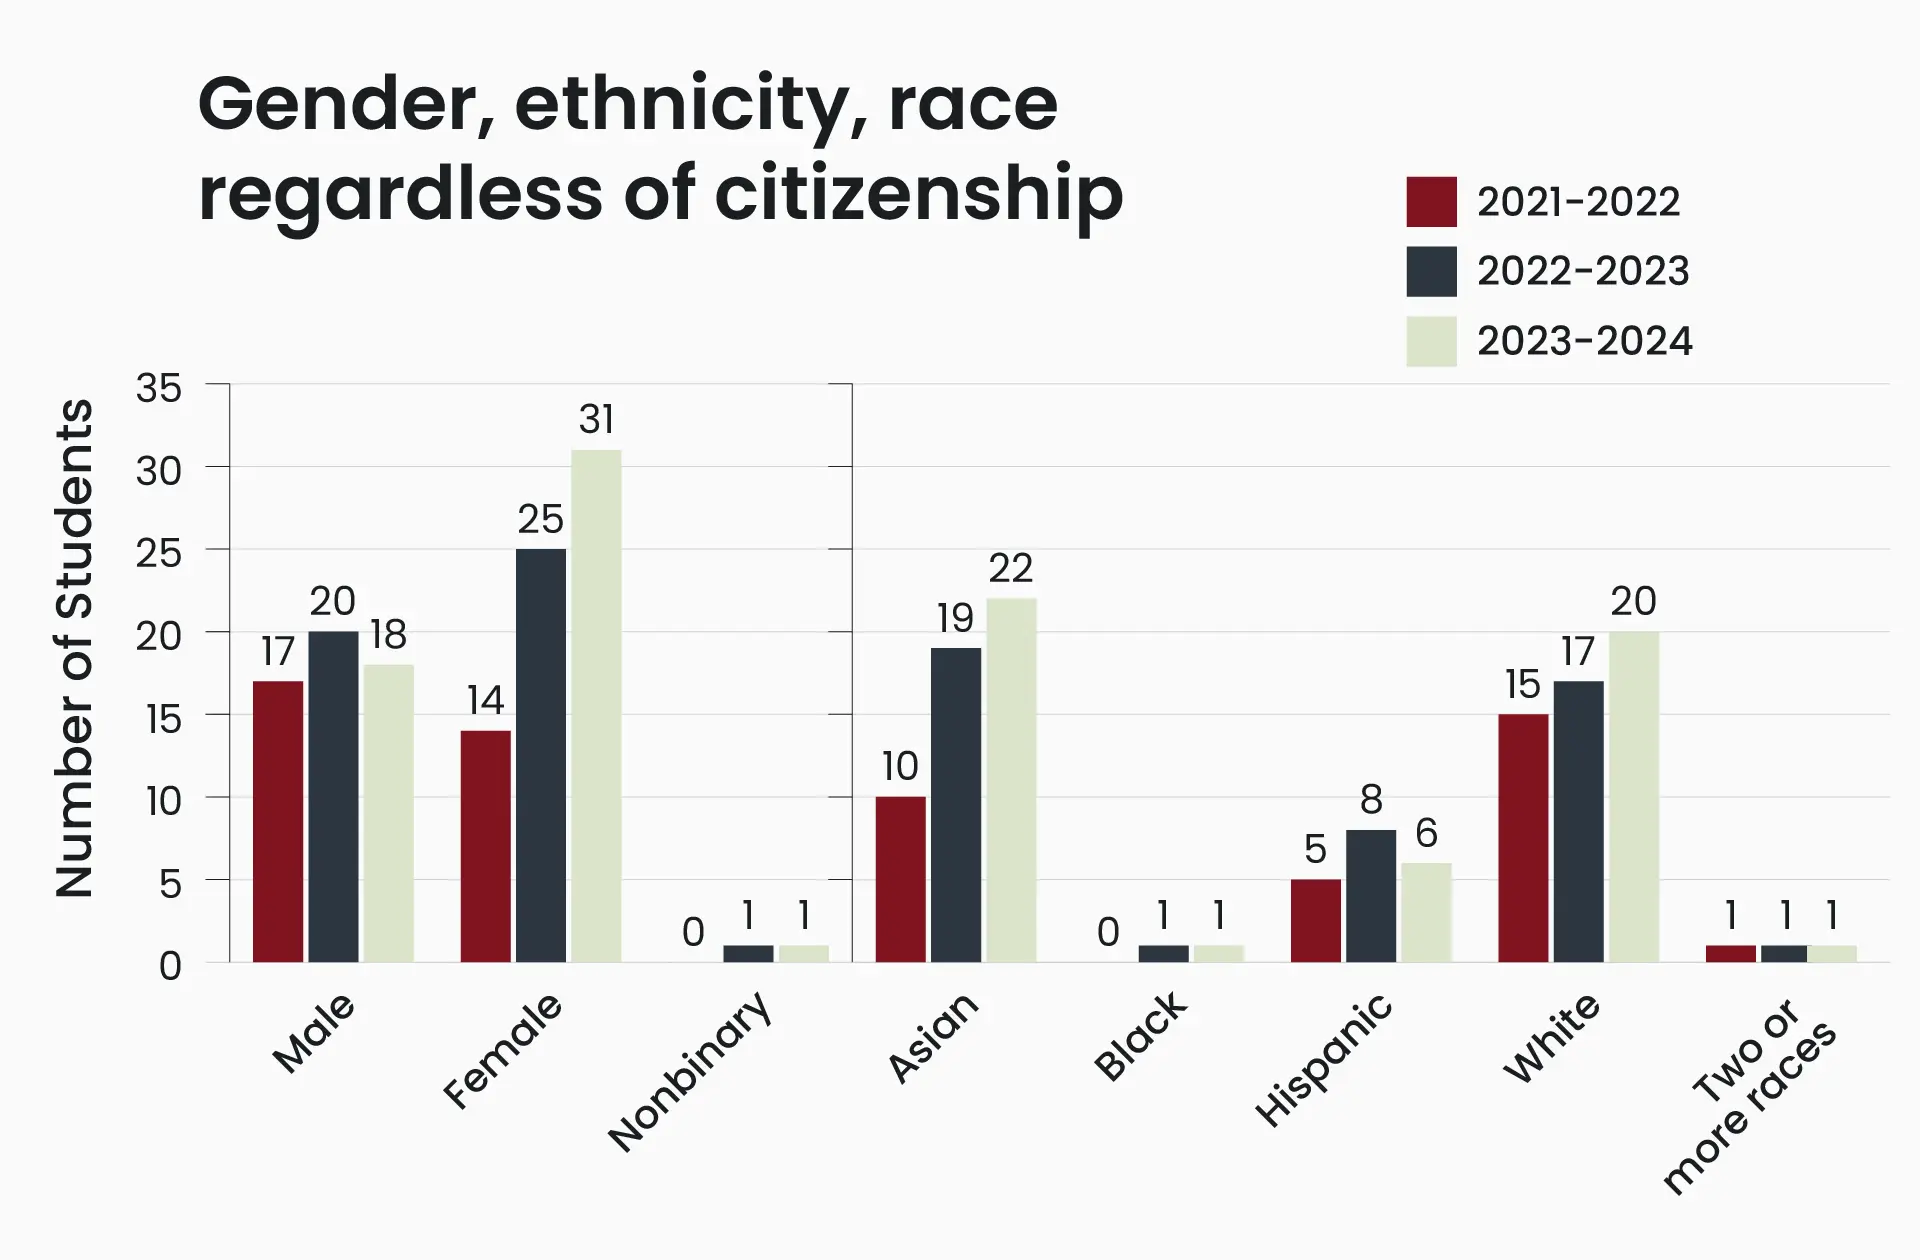
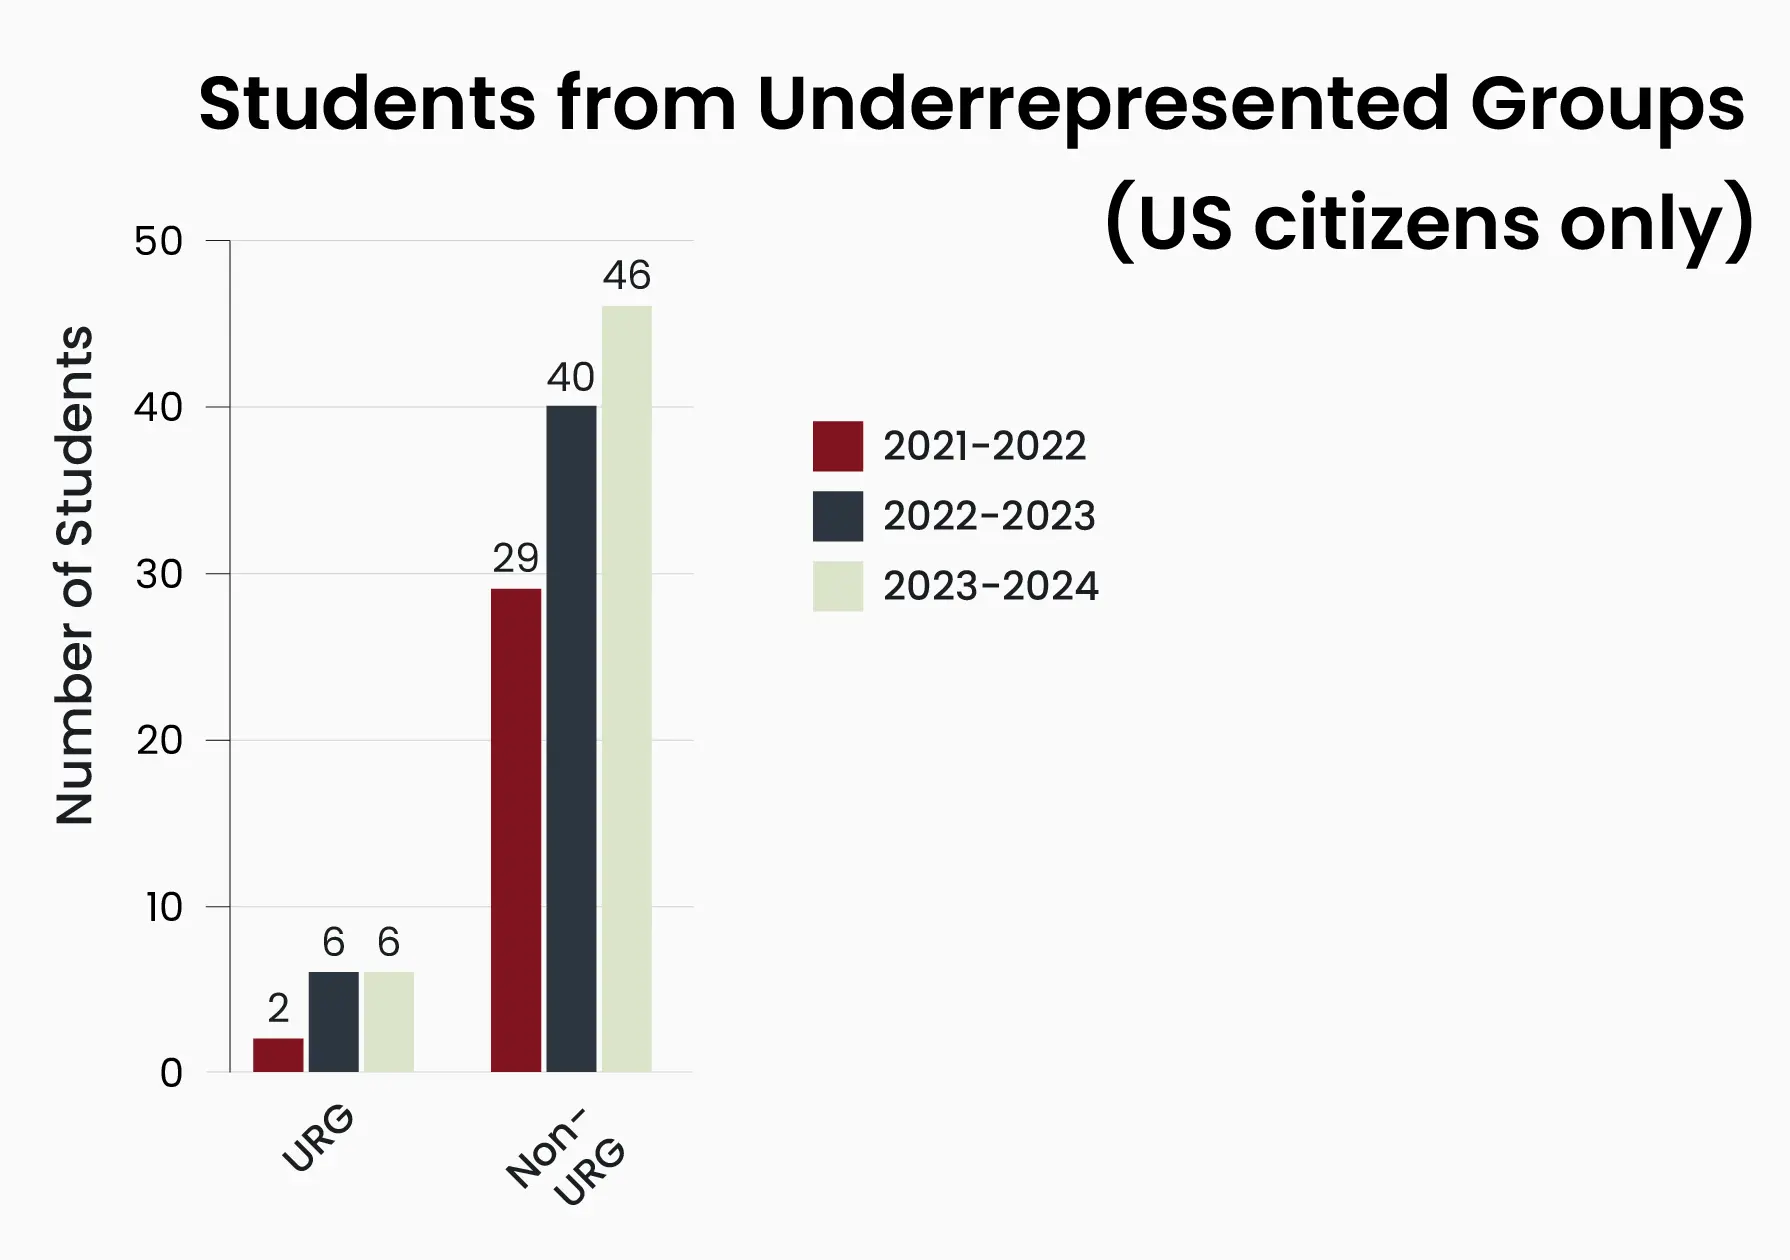
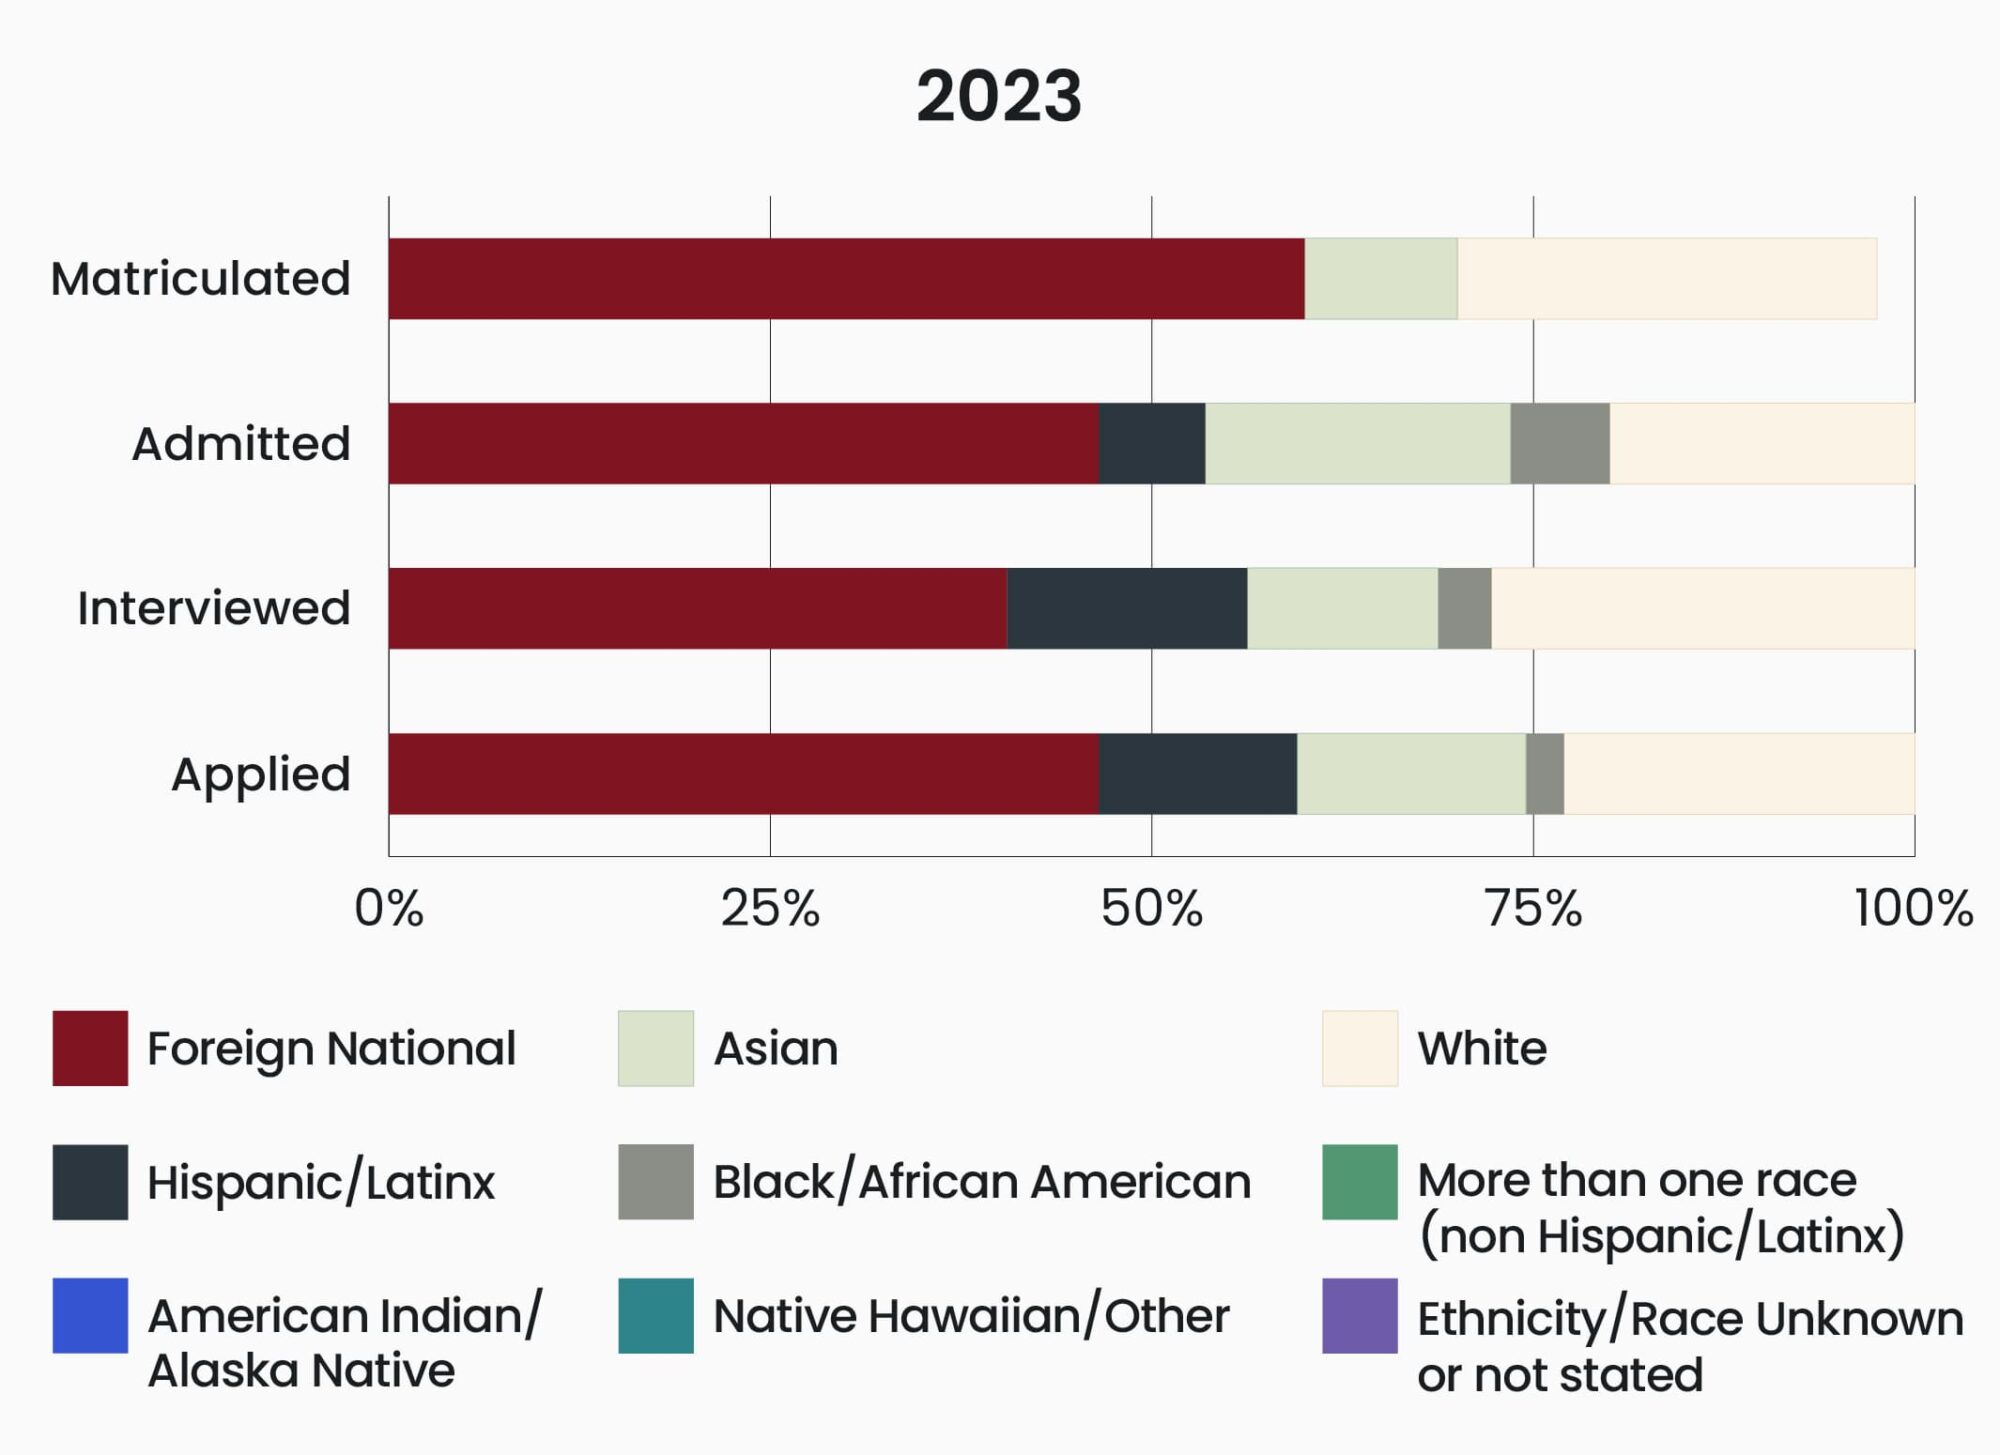
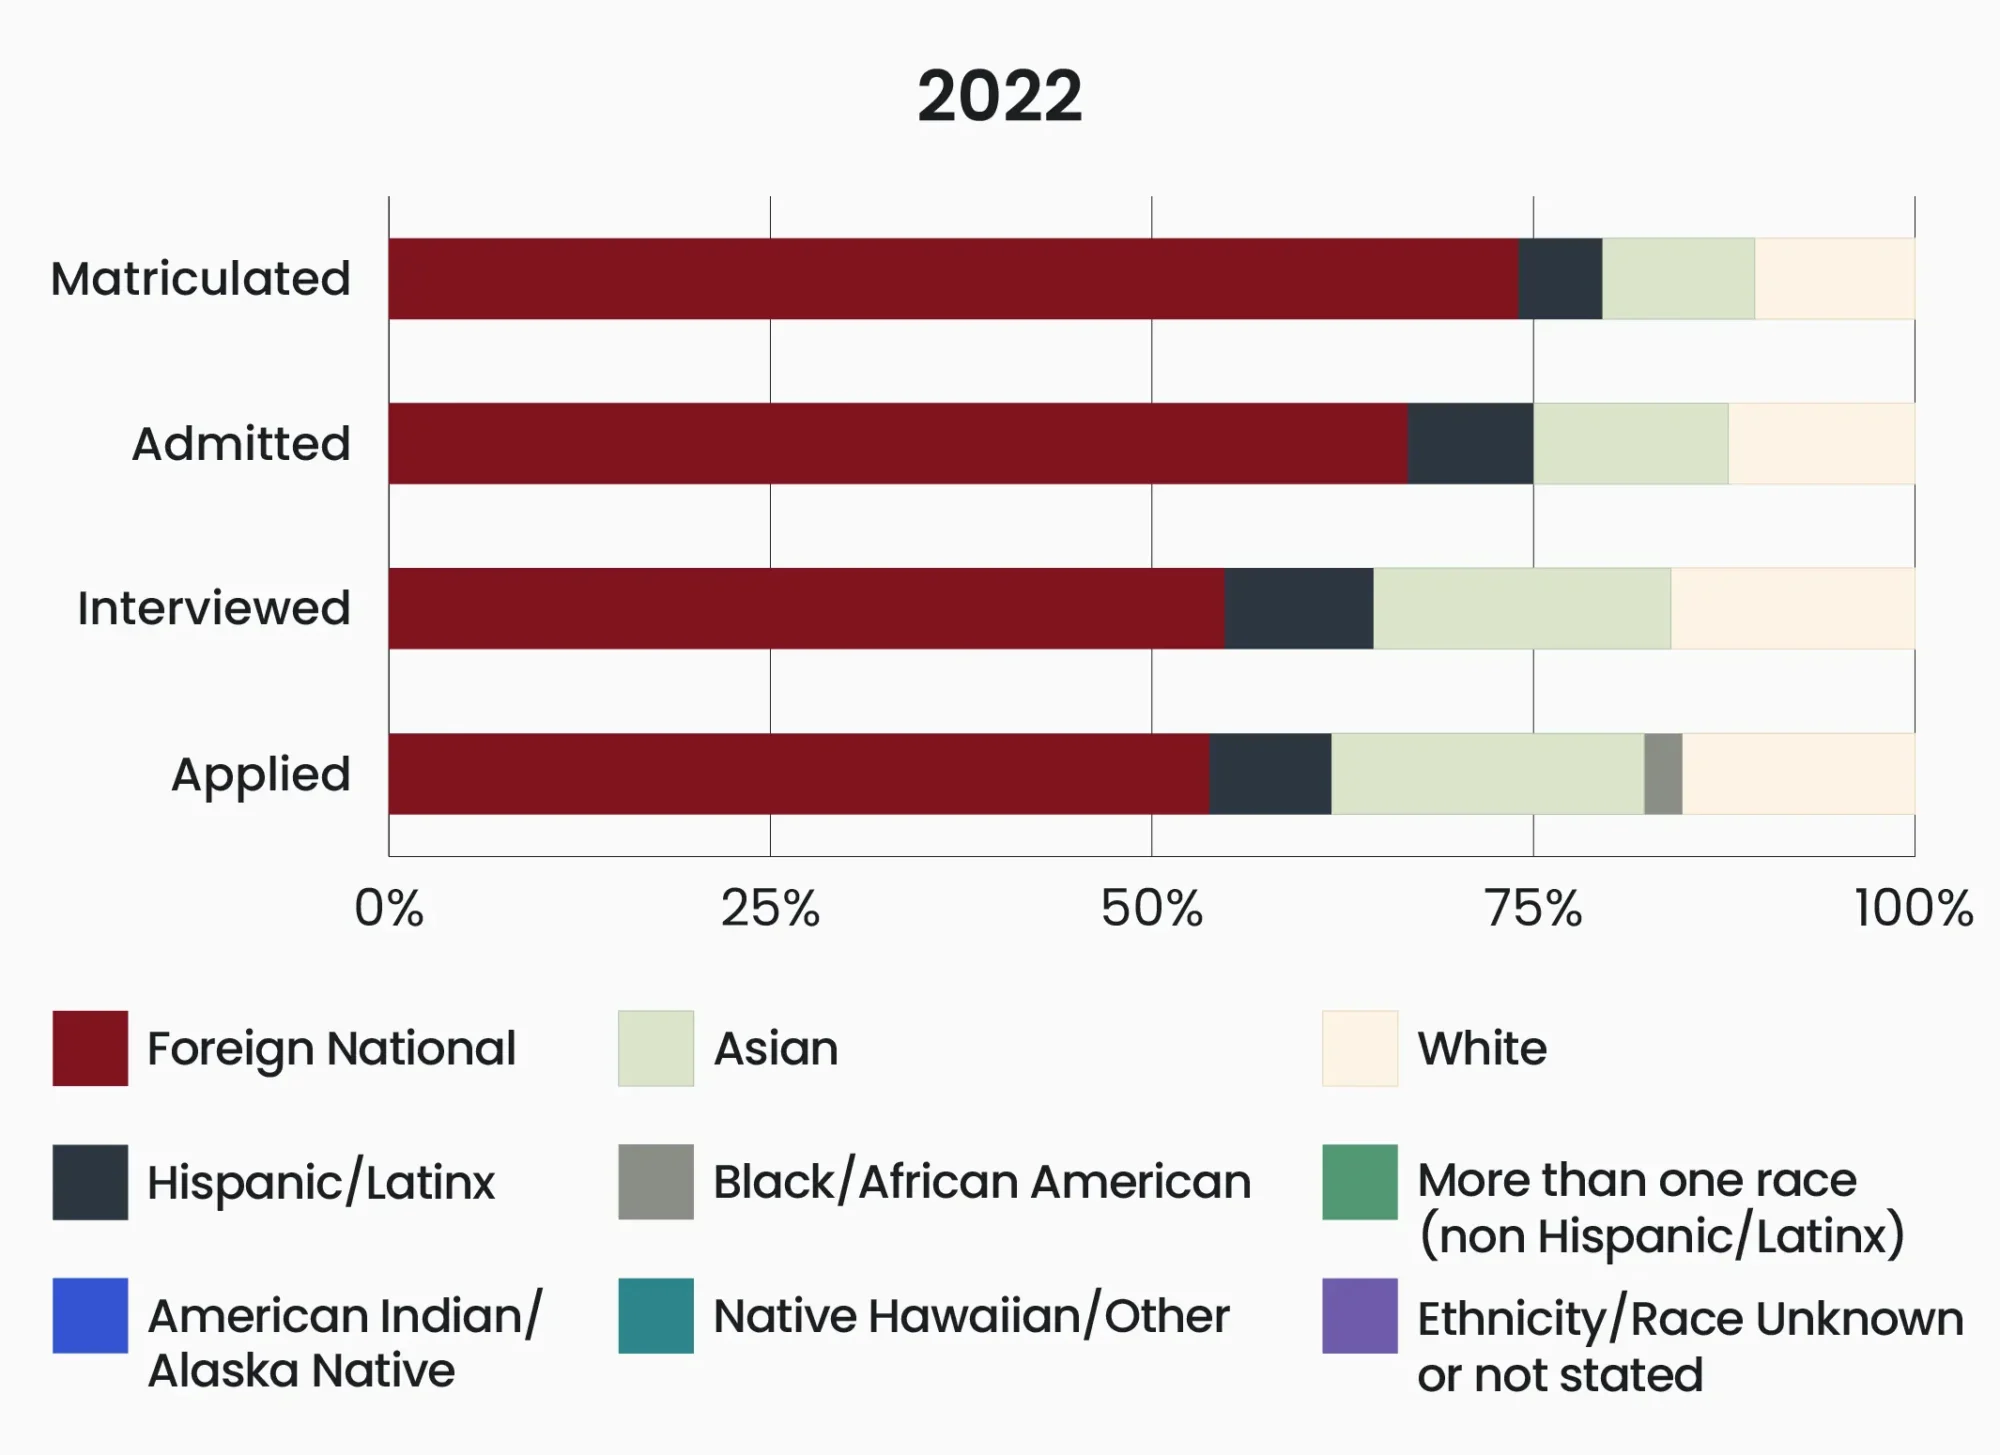
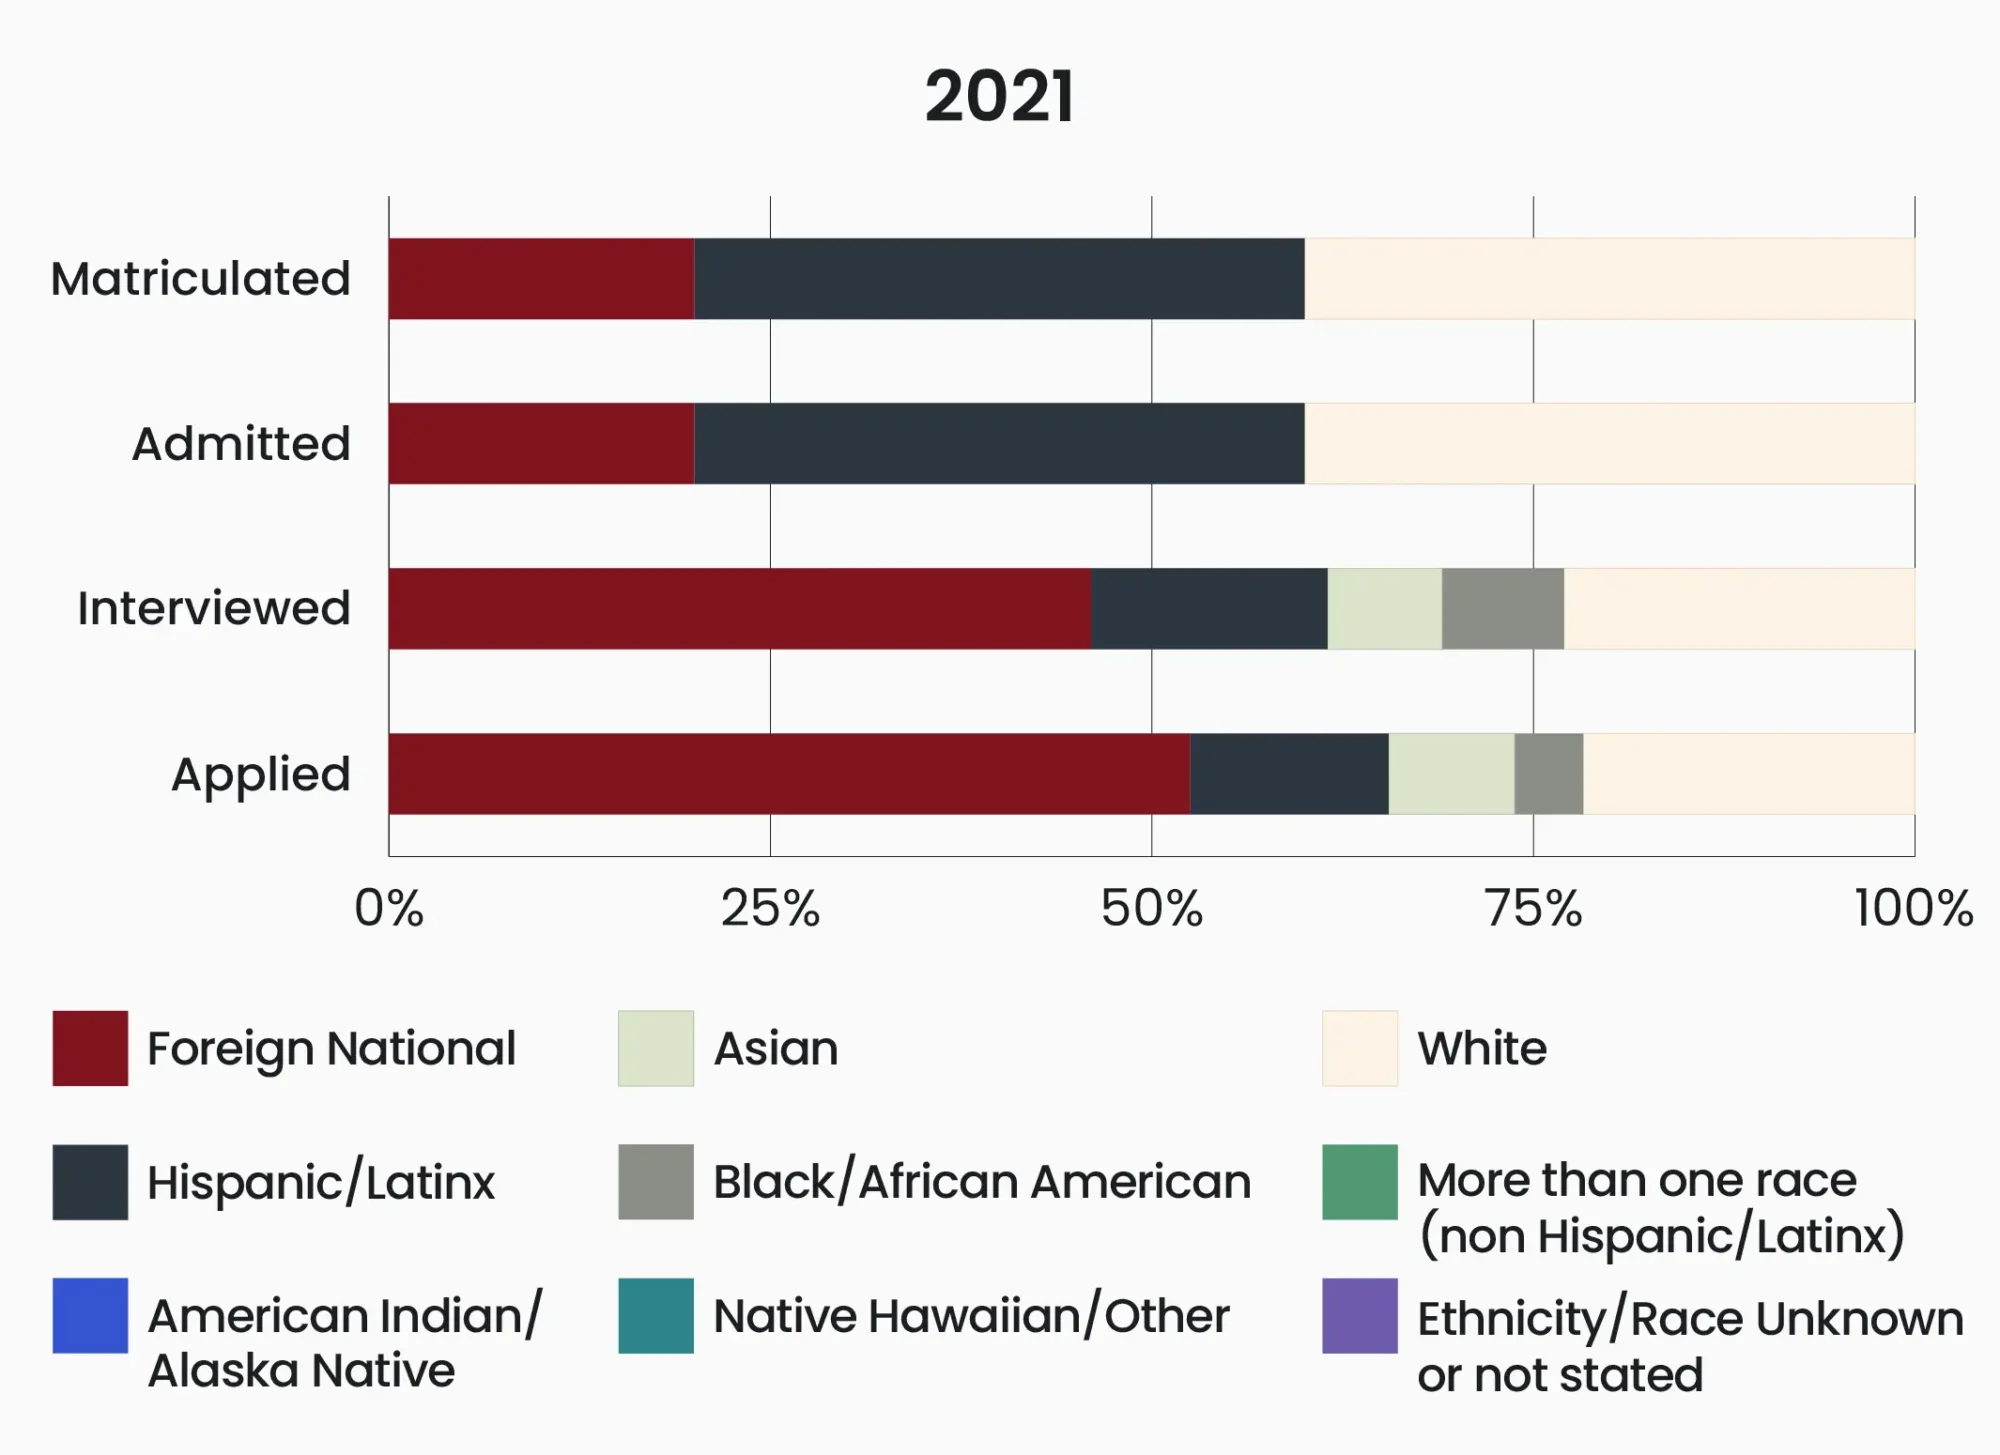
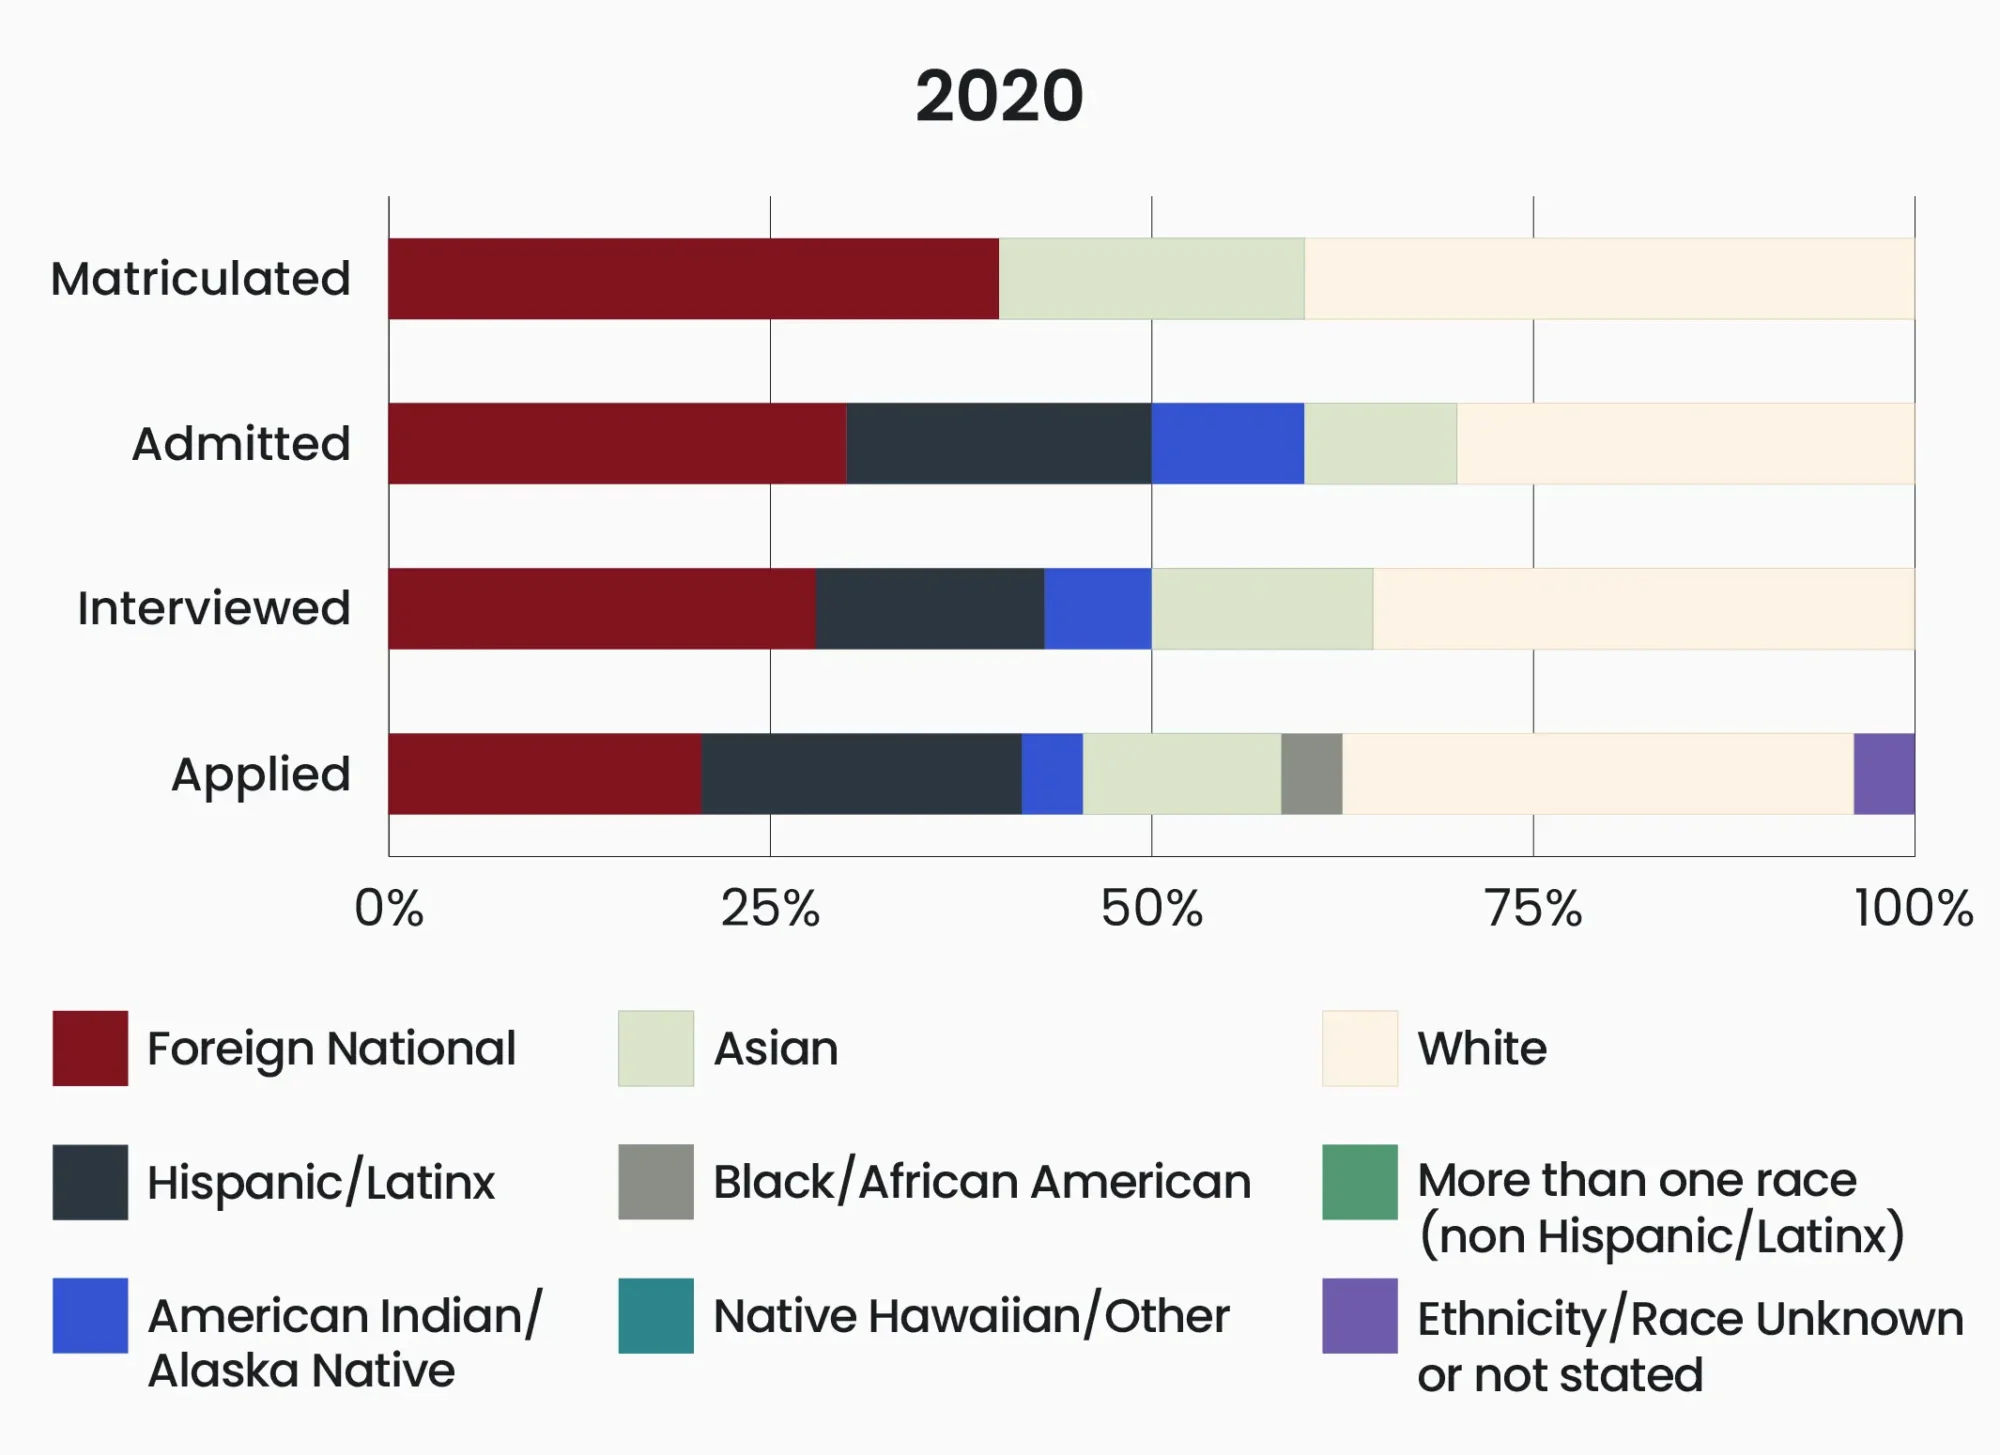
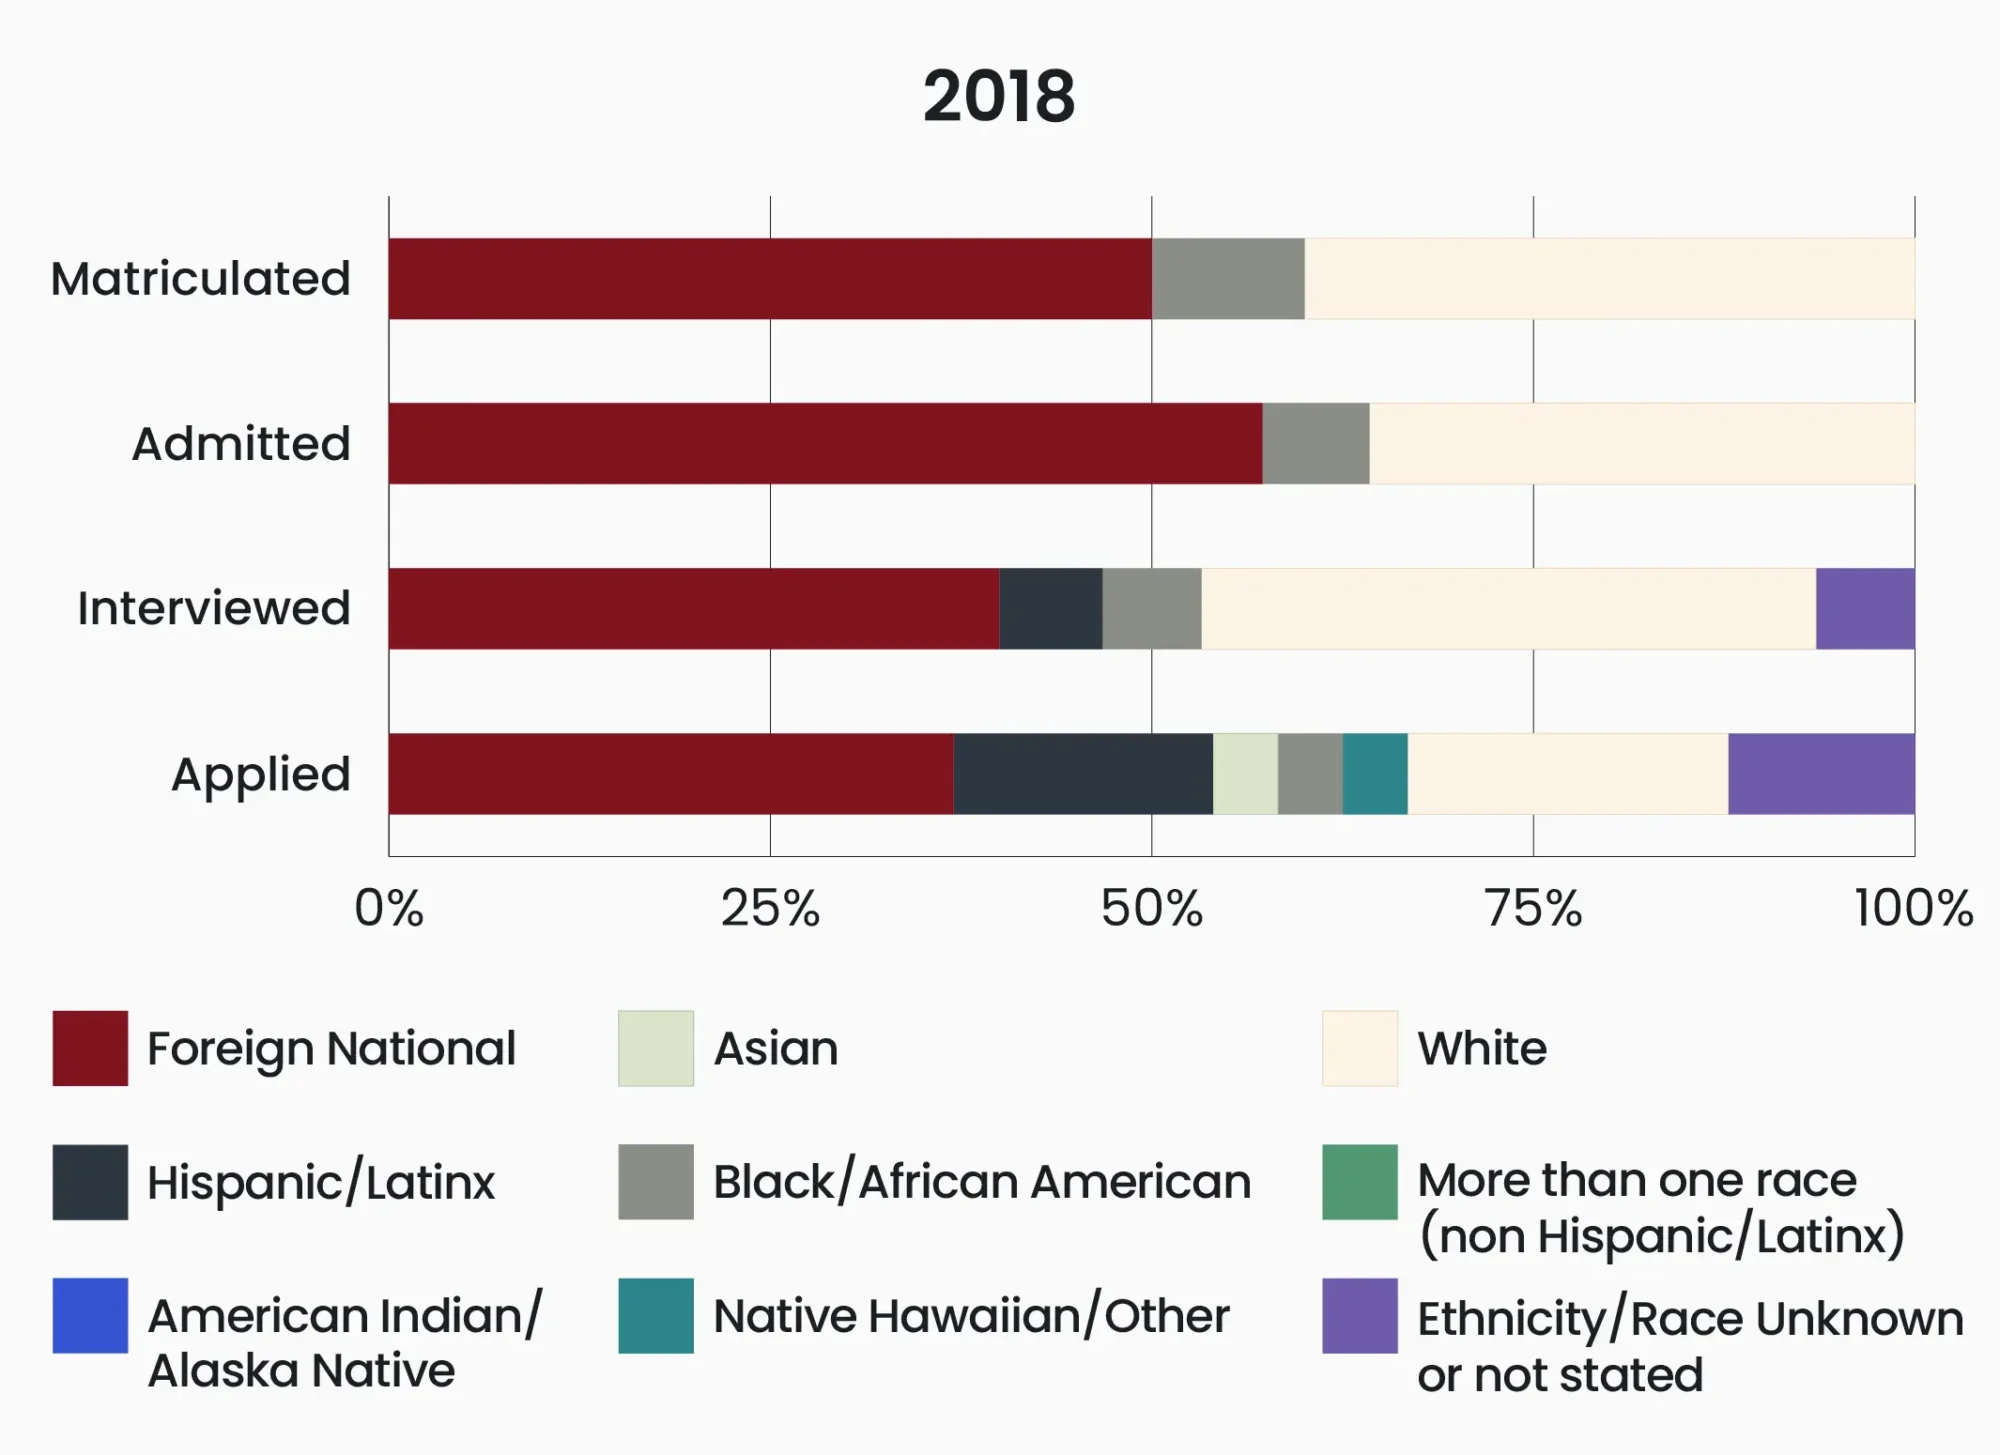
Student Body Composition
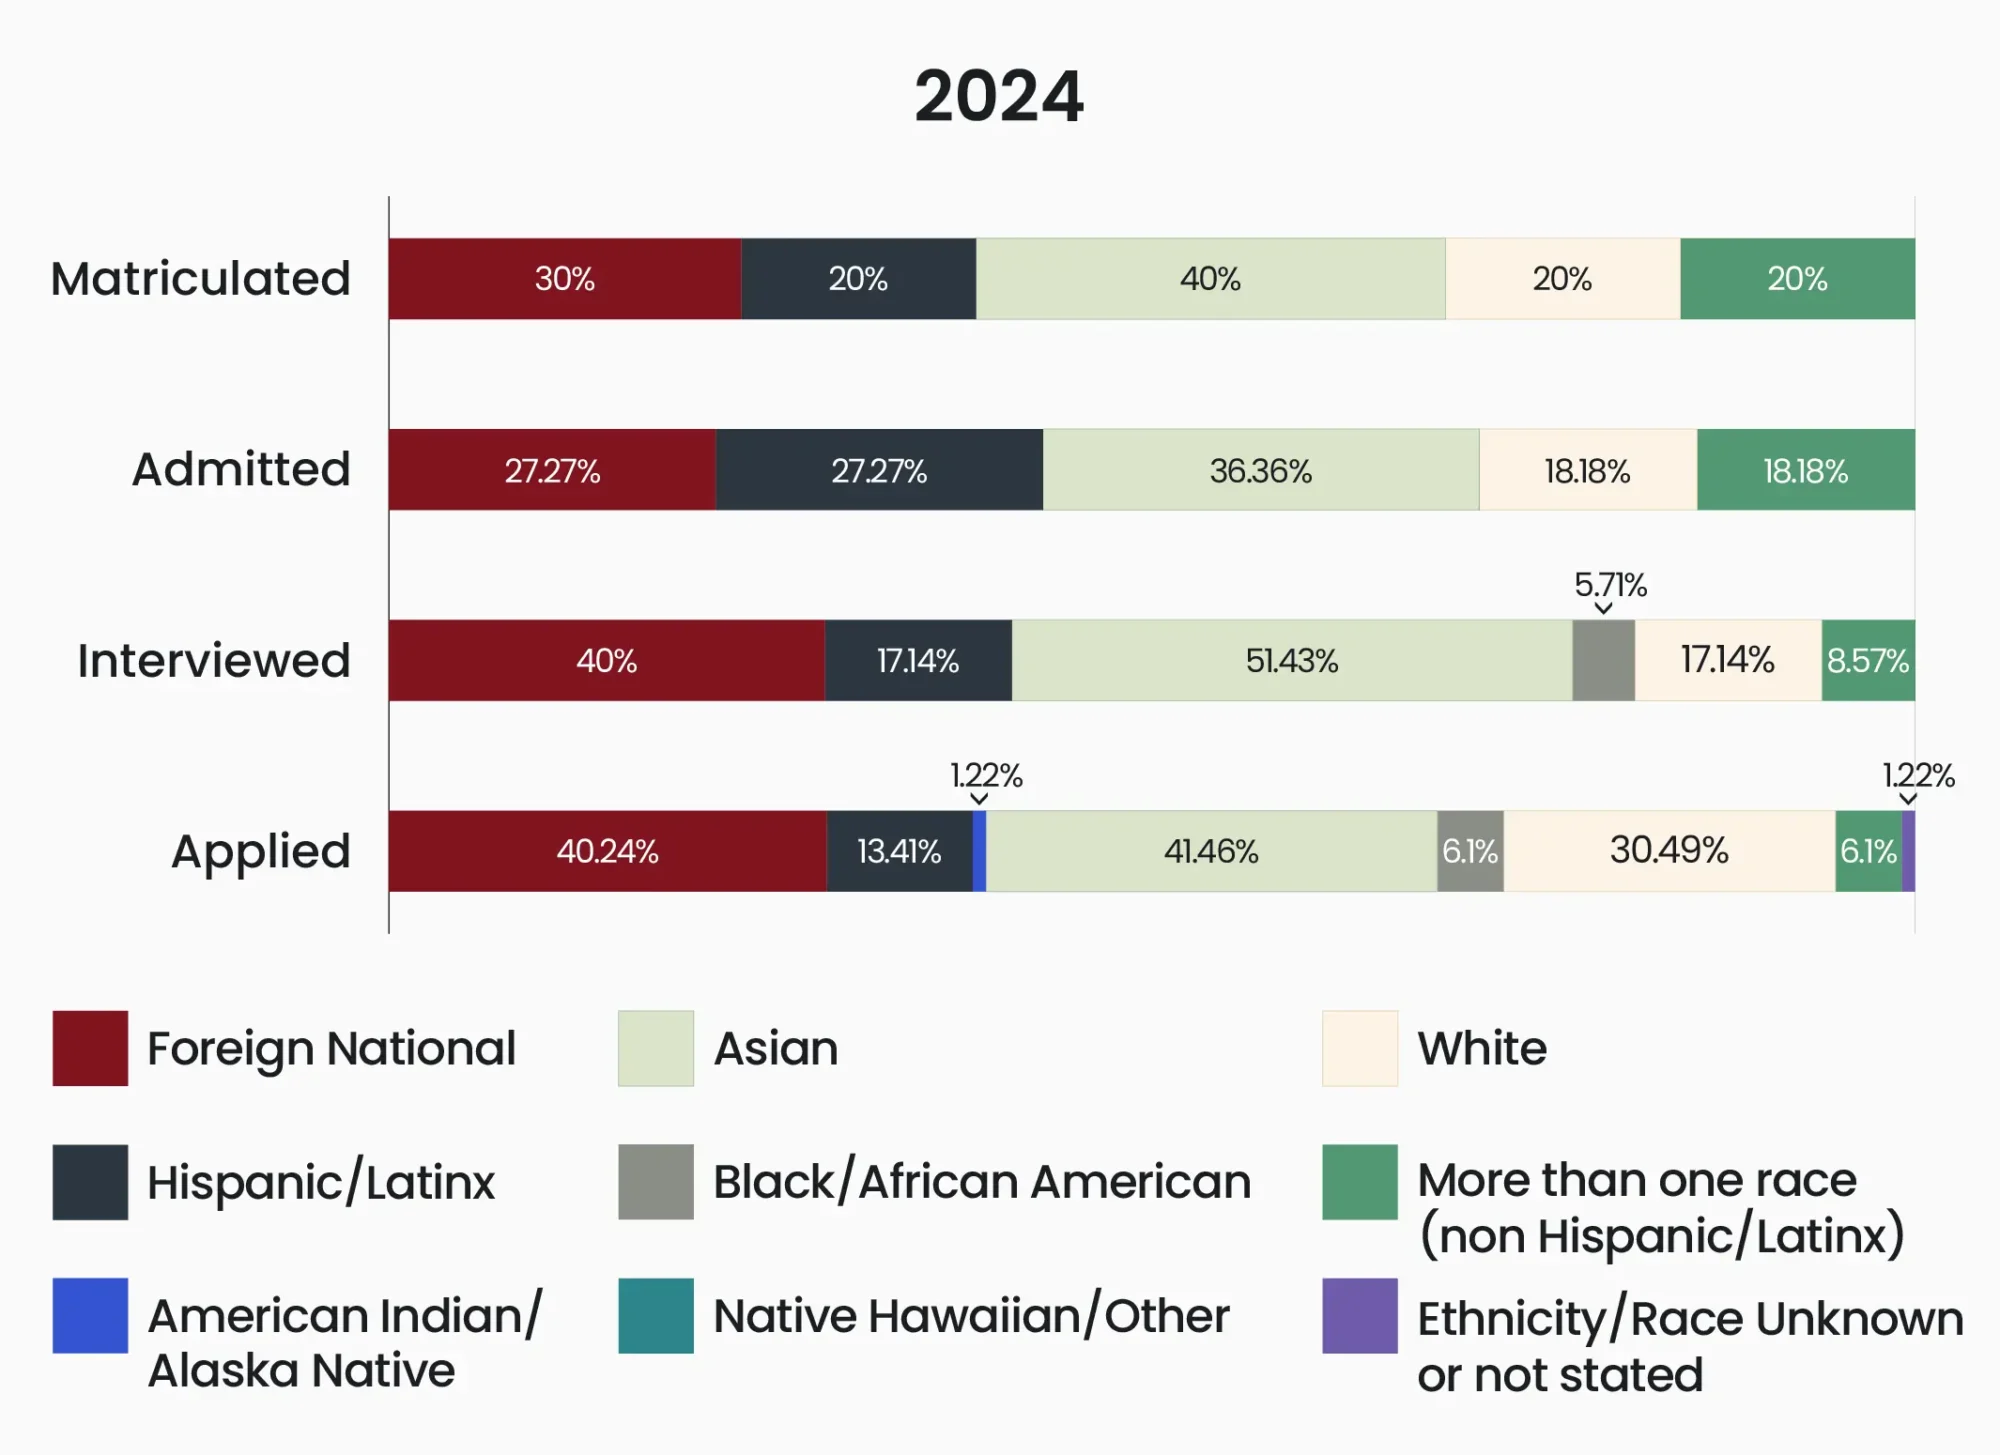
Admissions

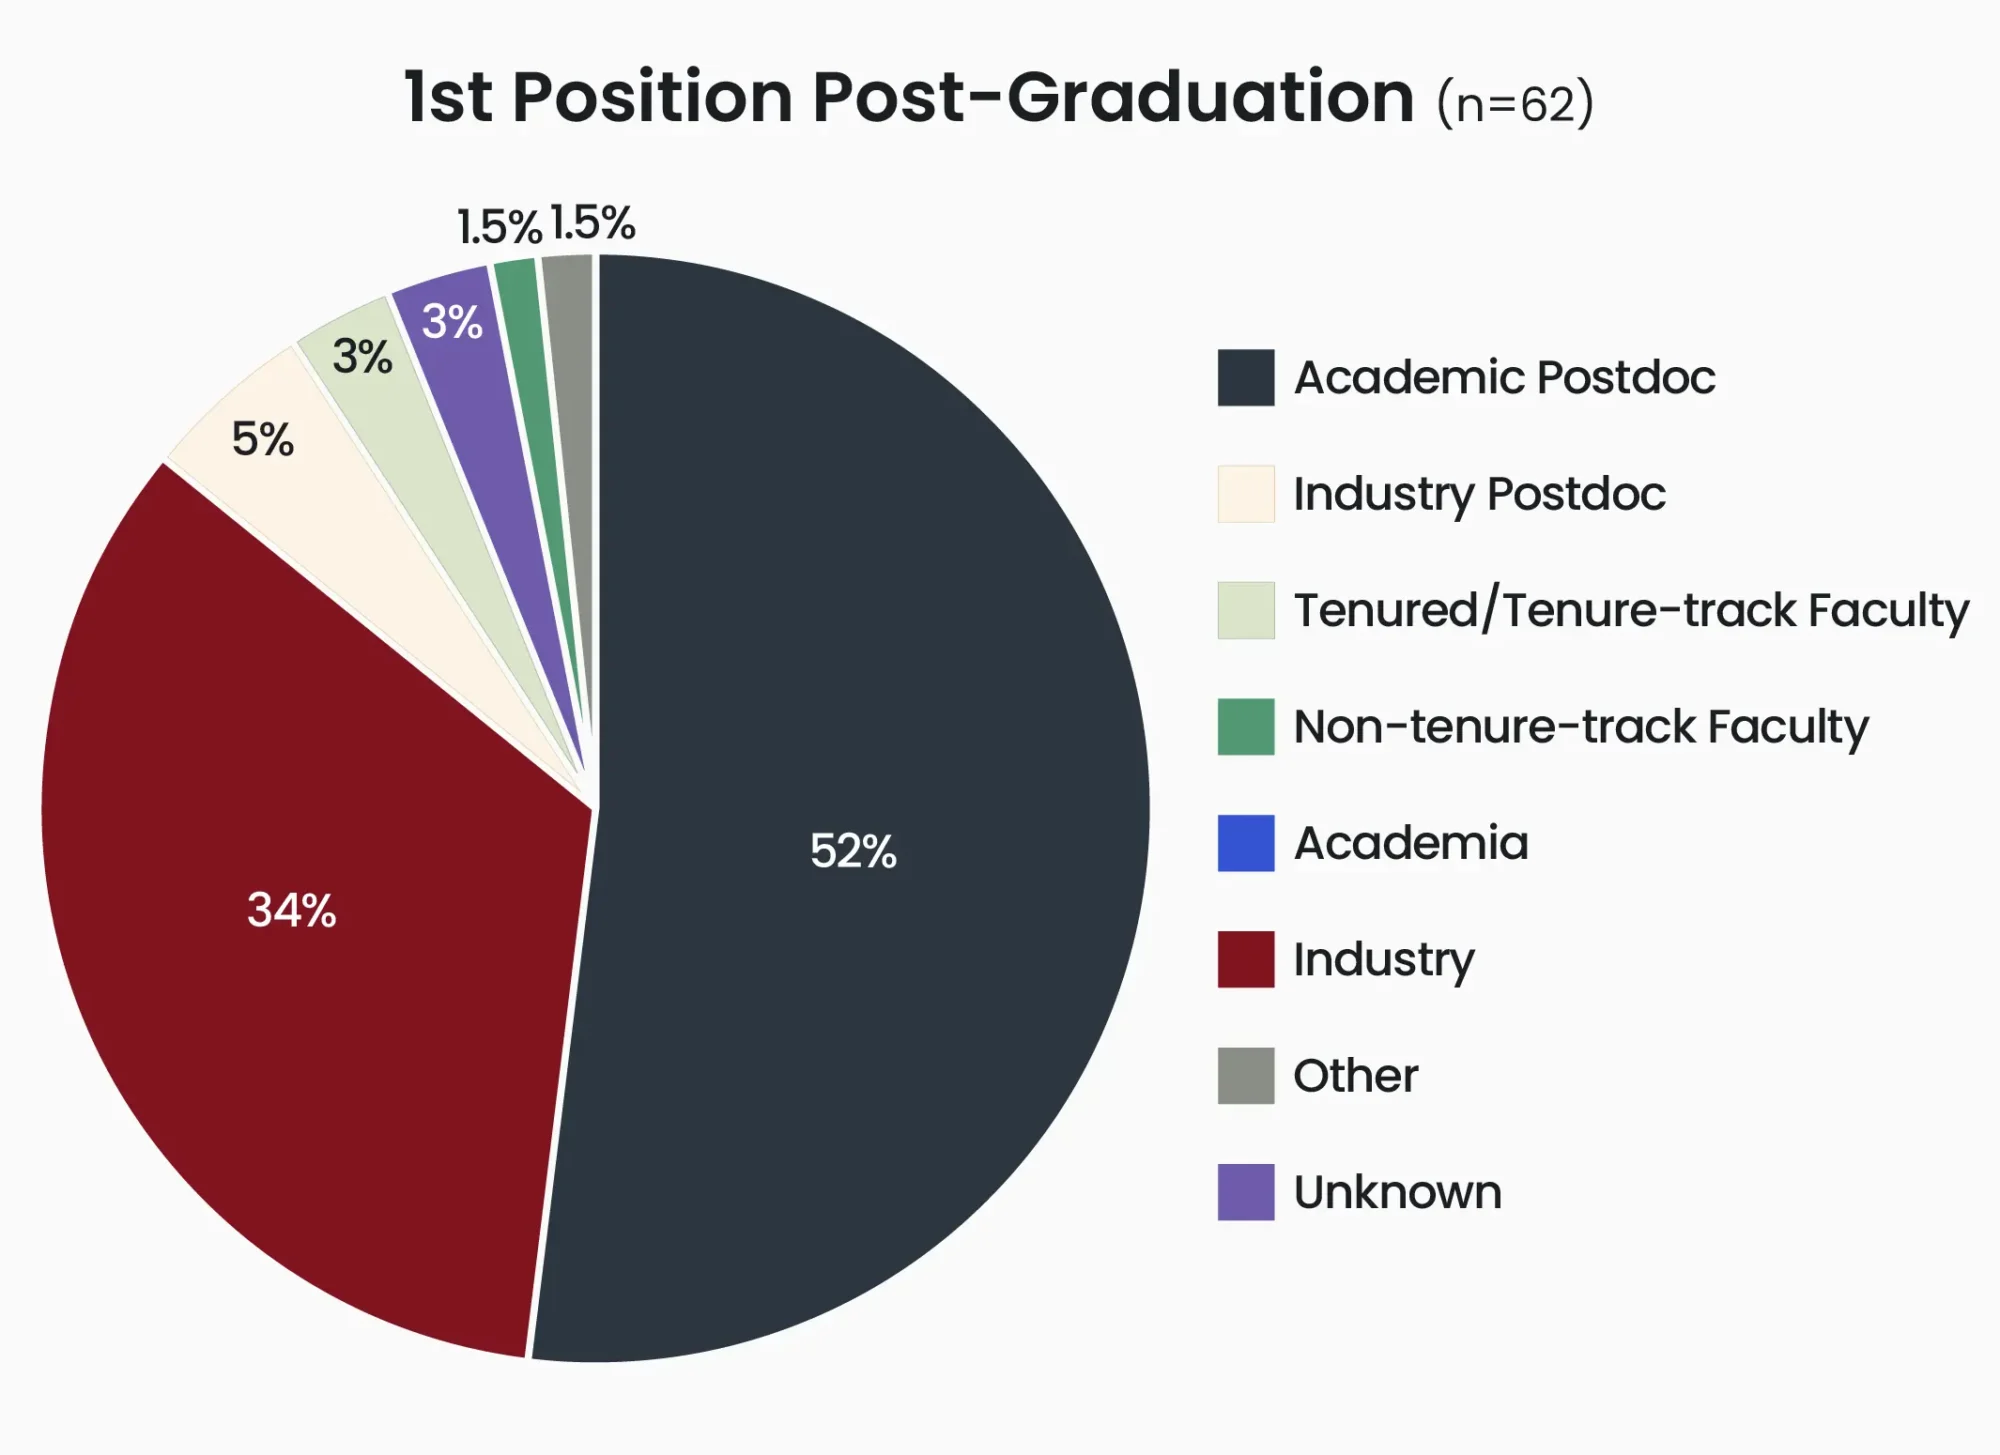
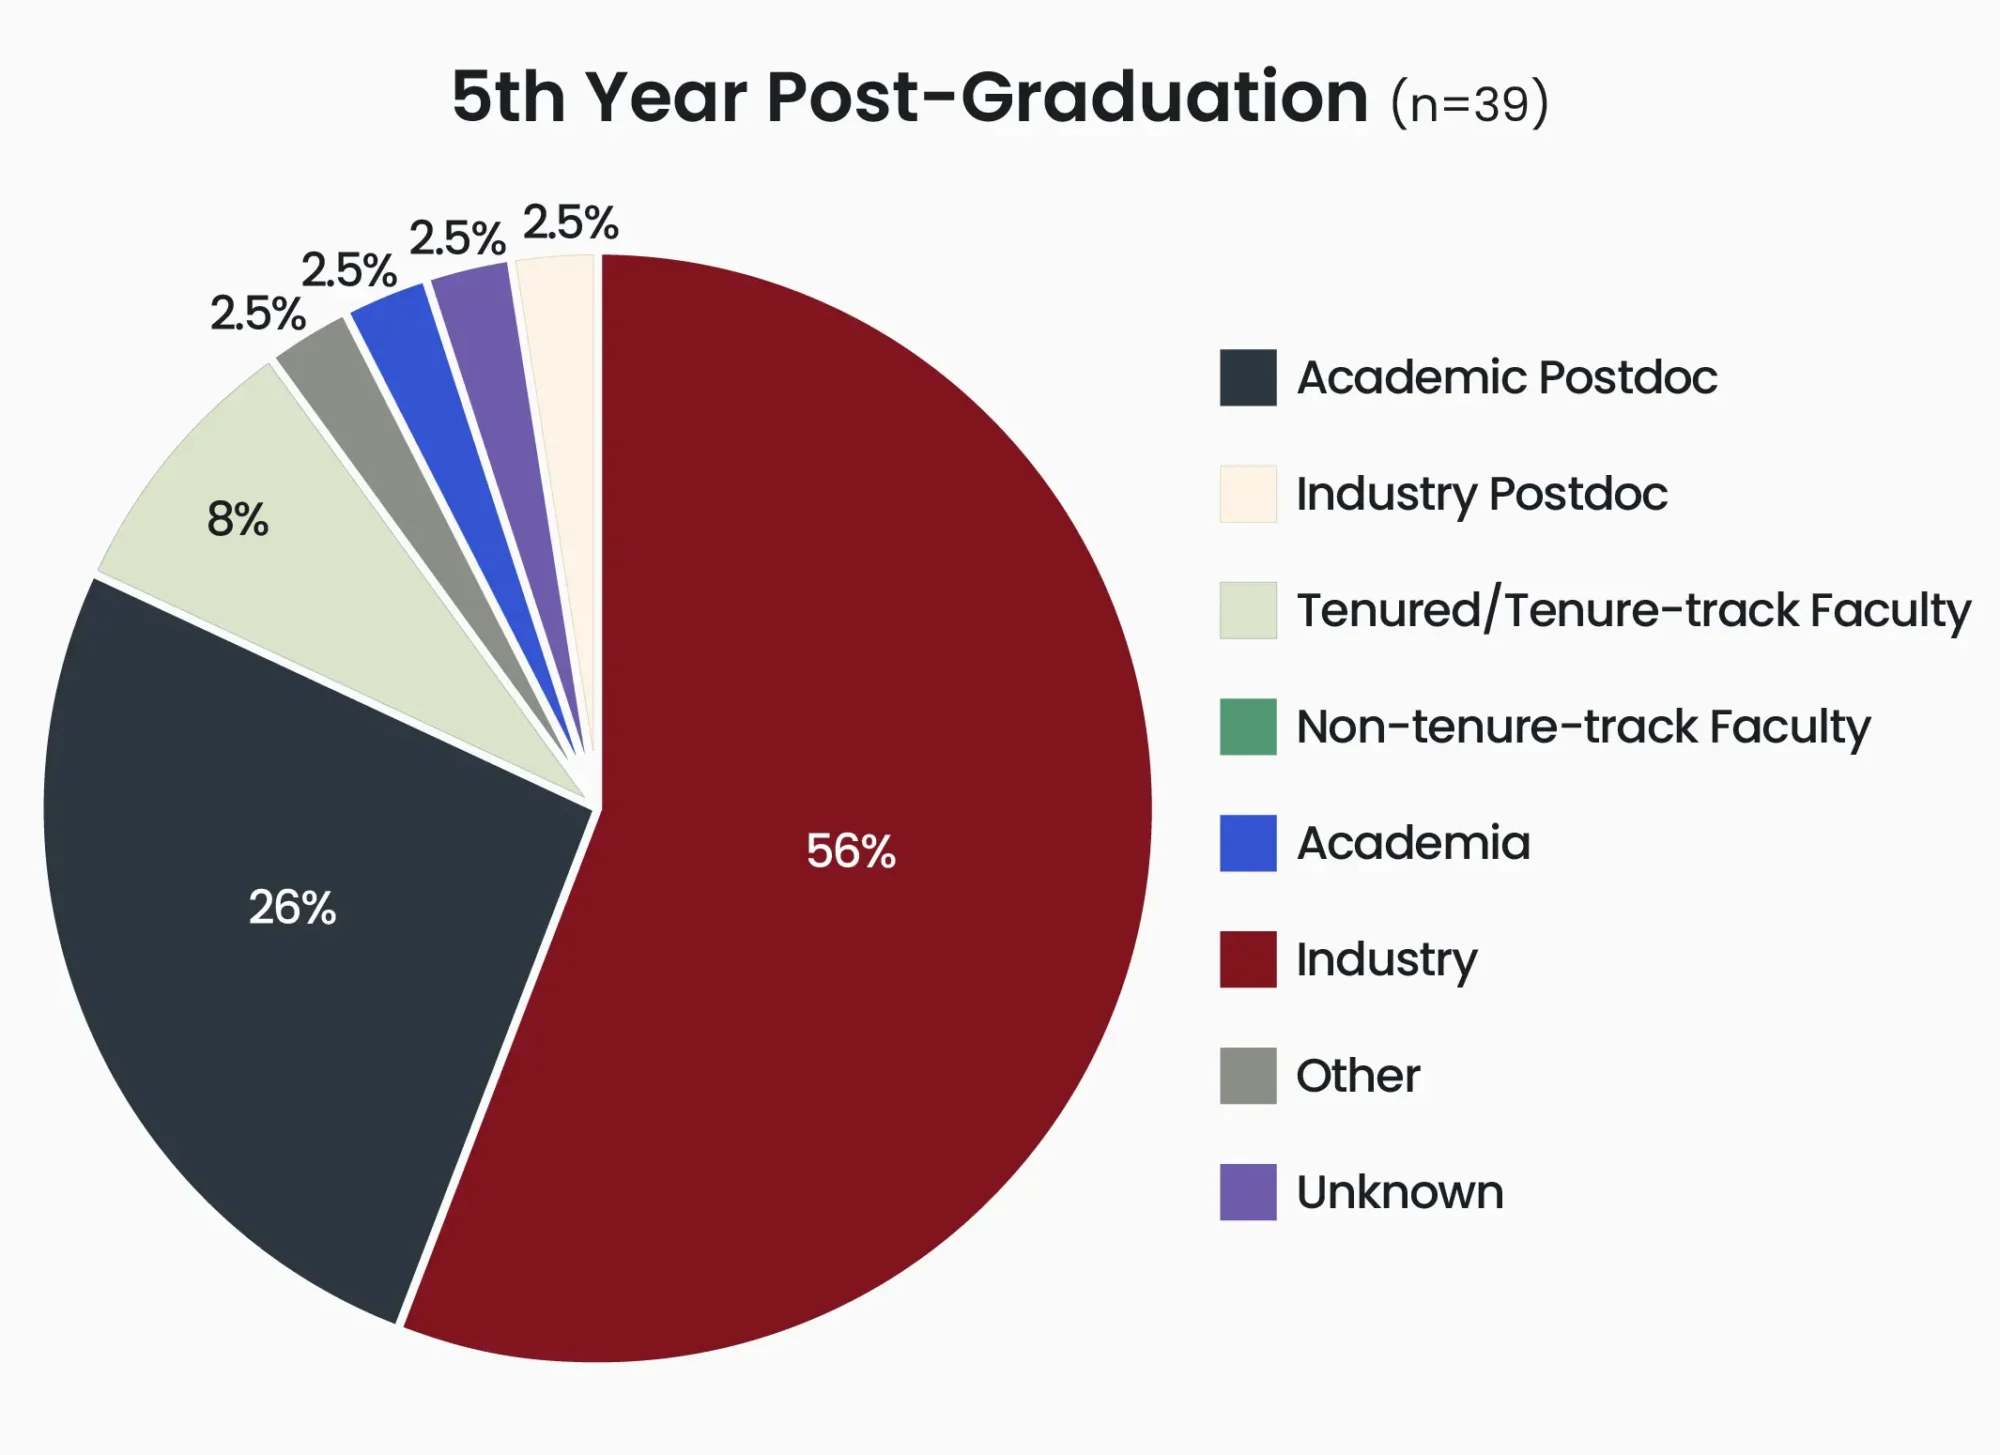
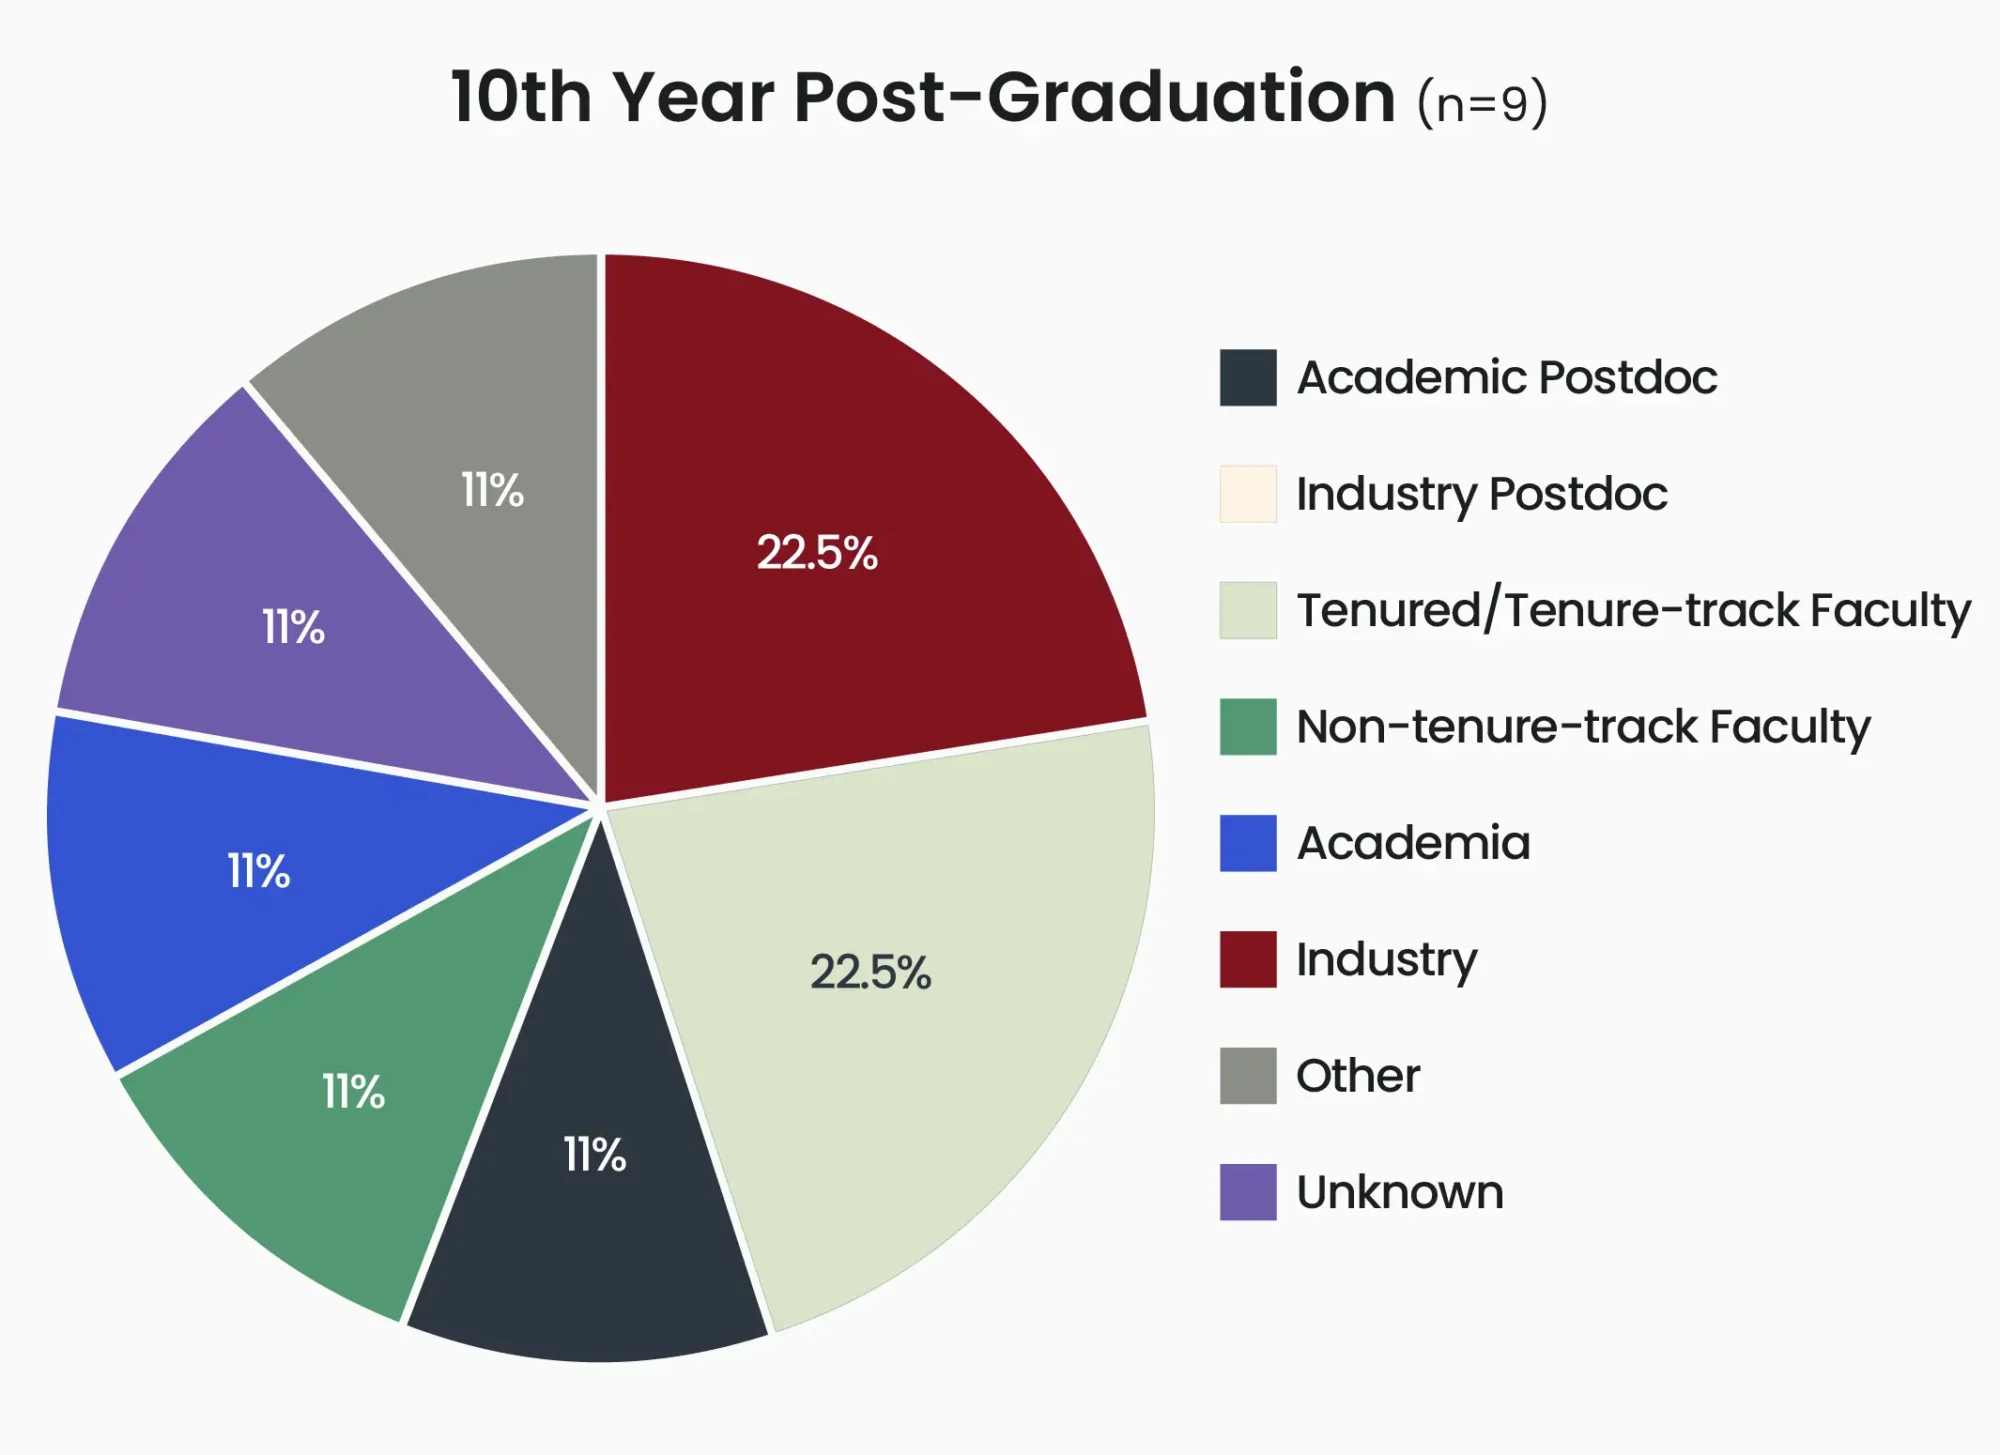
Alumni Placement
Retention Rate
| Retention Rate Gender, citizenship status, underrepresented groups | |
|---|---|
| Male | 94% |
| Female | 83.58% |
| Nonbinary | 100% |
| Non-U.S. Citizen | 87.5% |
| U.S. Citizen | 88.2% |
| Underrepresented Group | 81.25% |
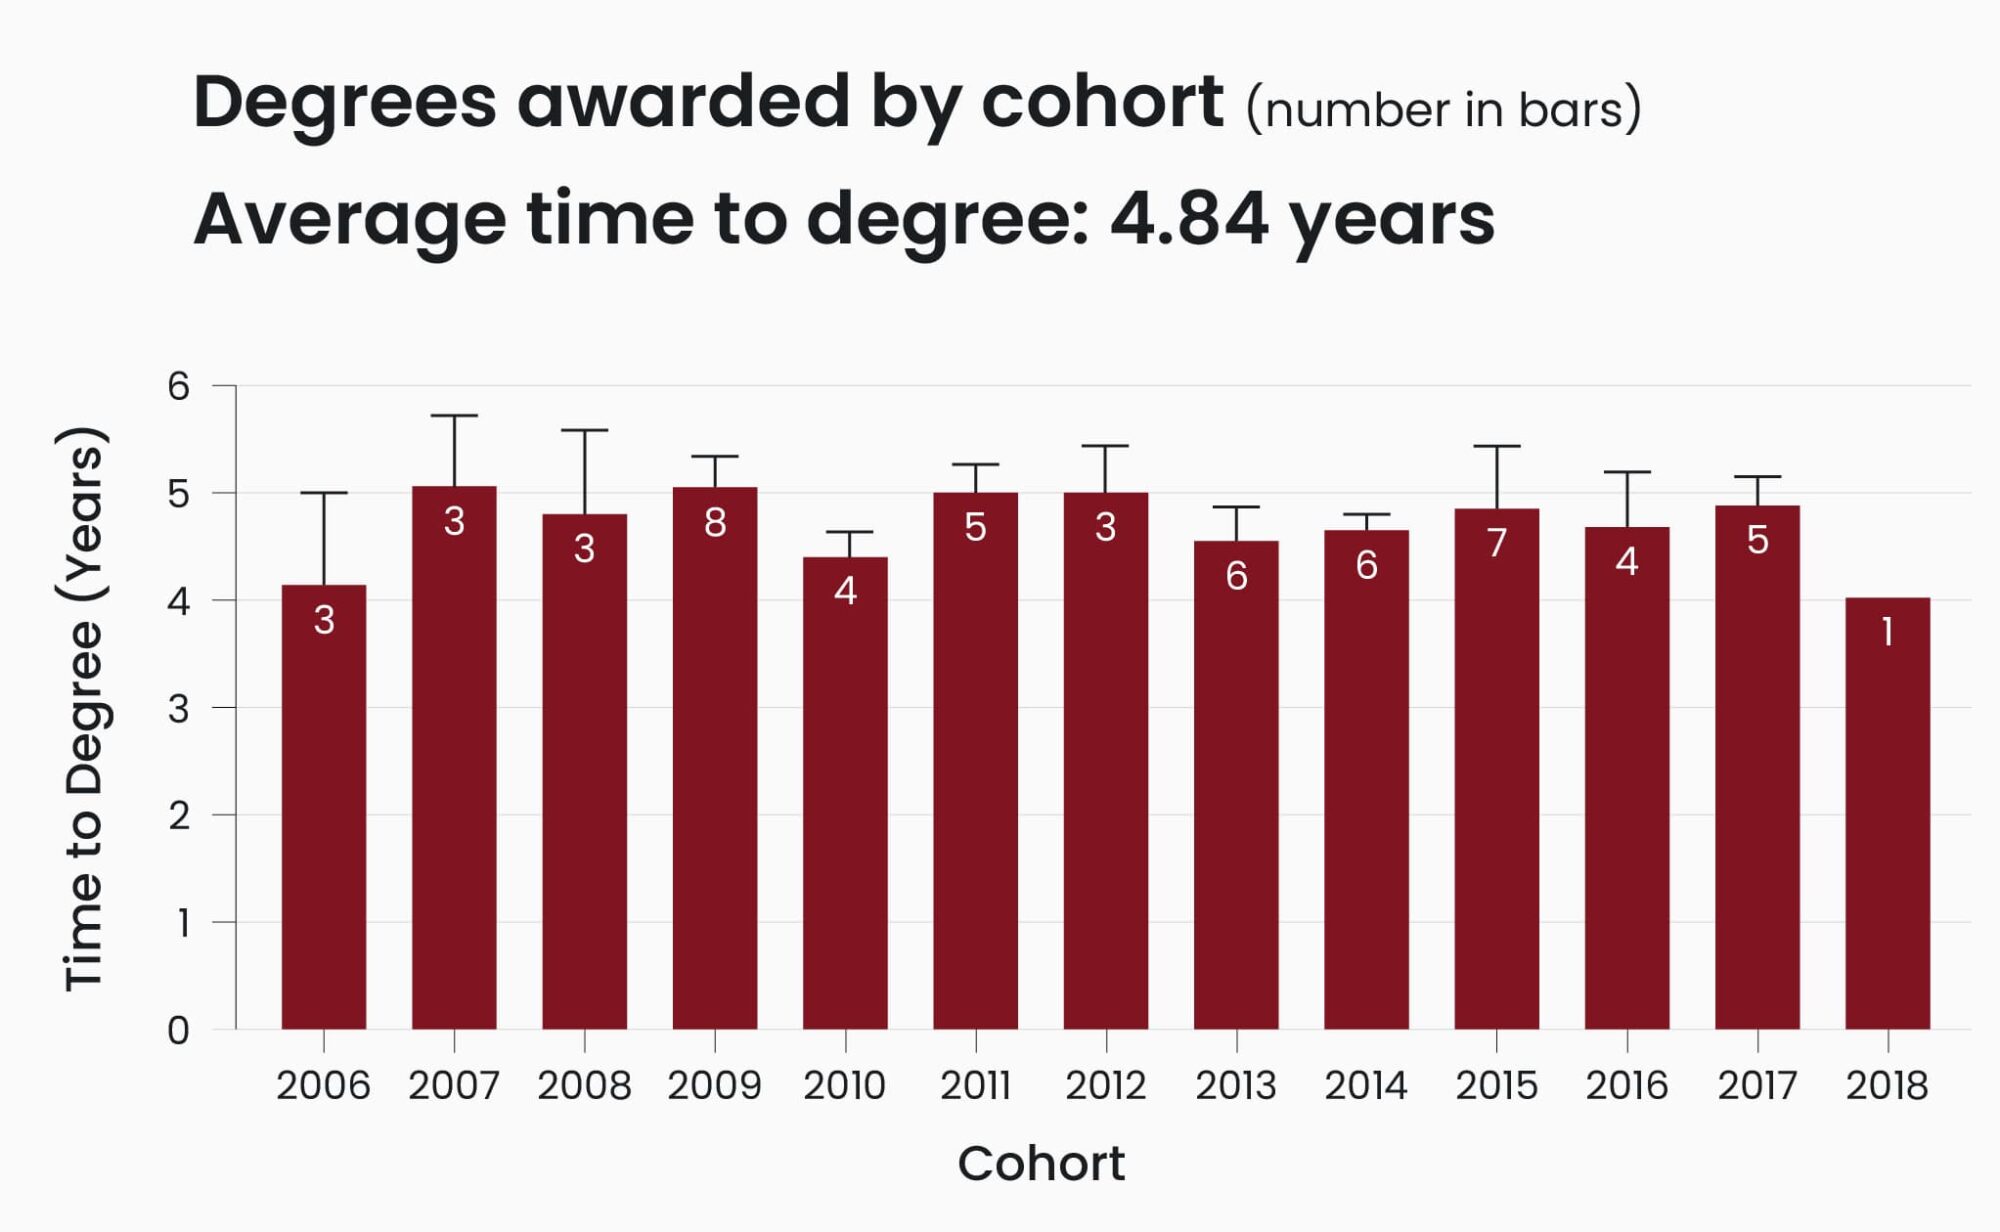
Time to Degree (By Cohort)
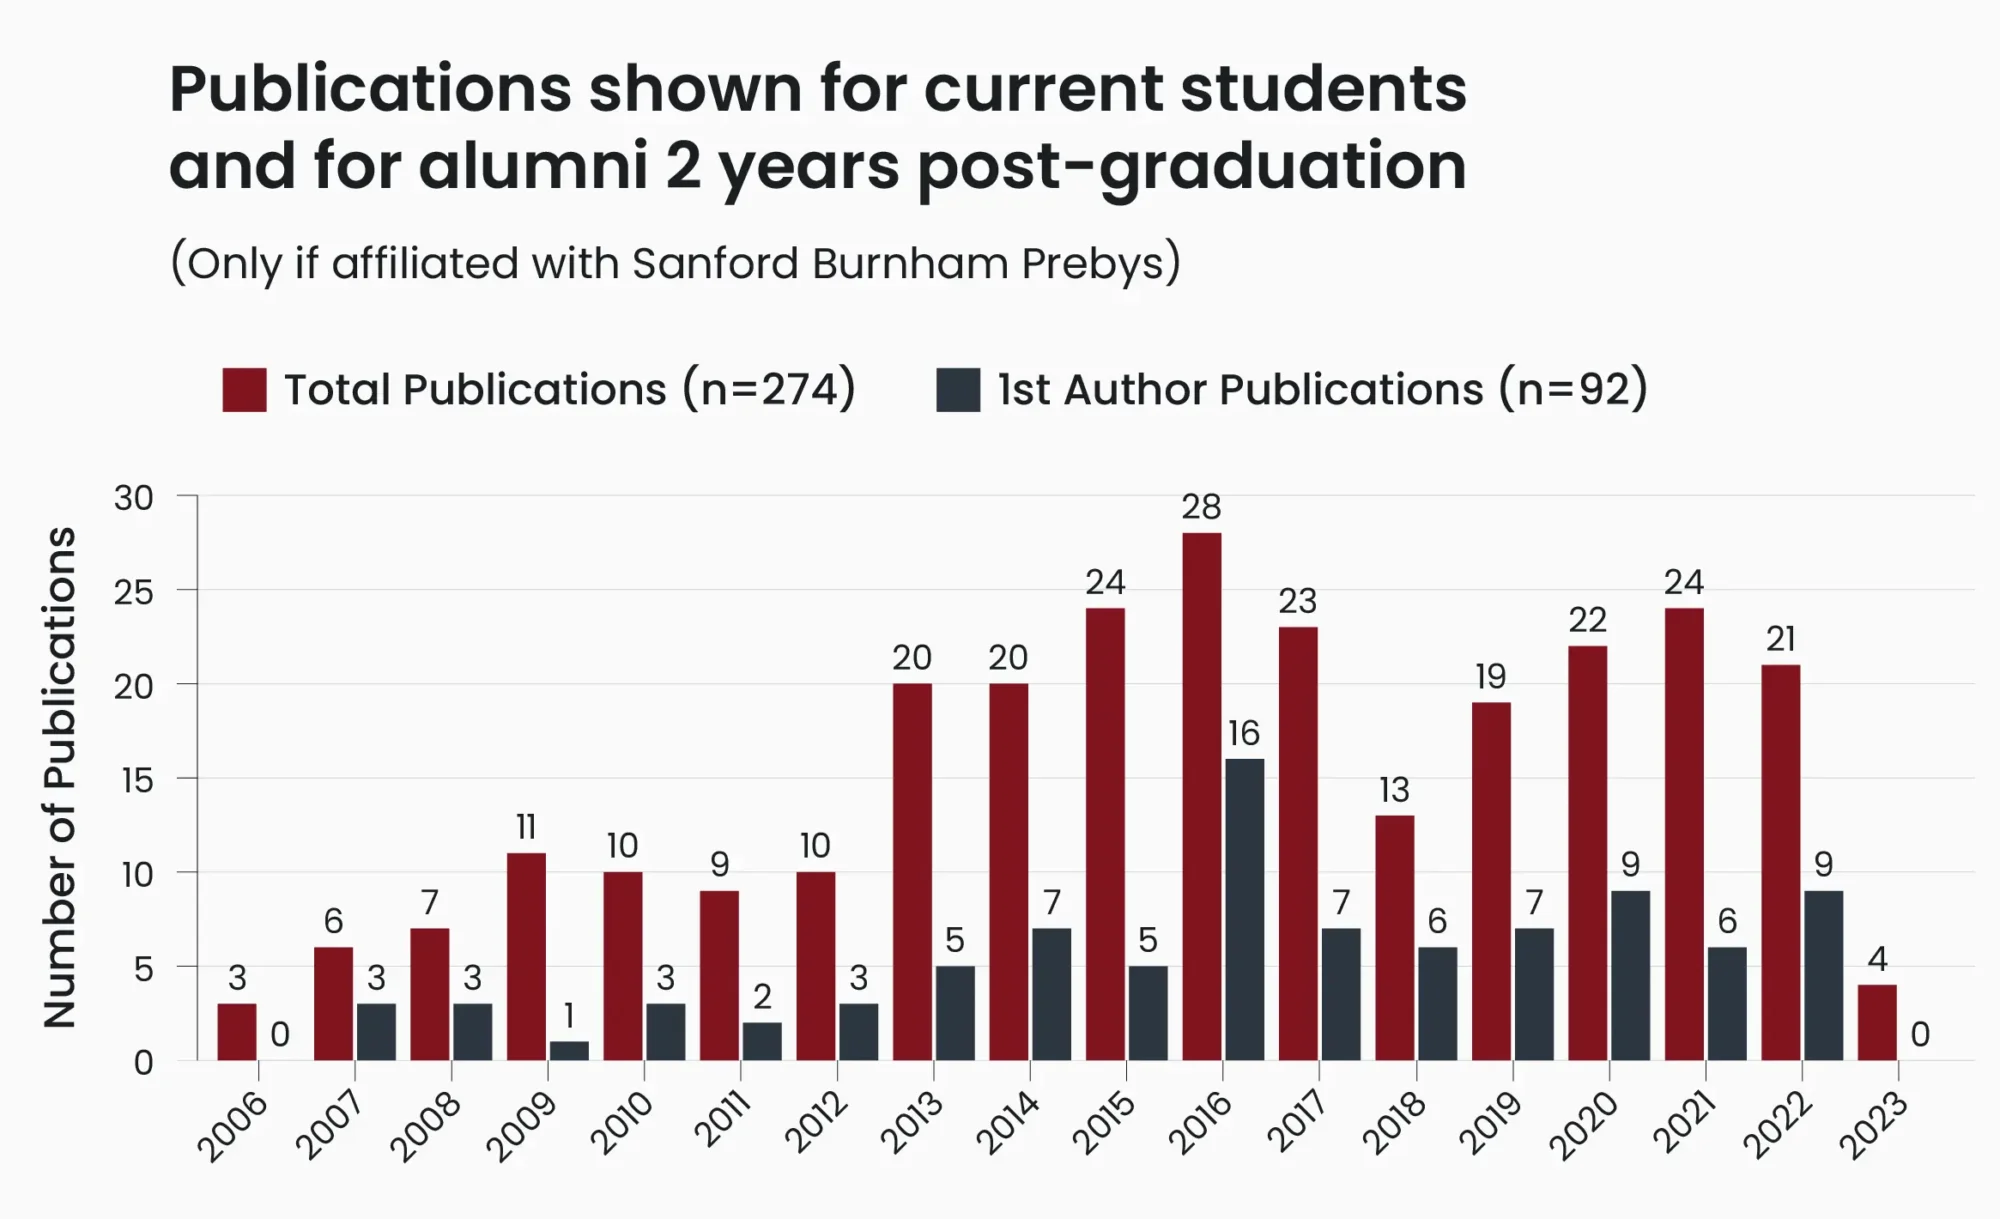
Student Publications
The Graduate School of Biomedical Sciences is accredited by the WASC Senior College & University Commission.